With the development of trade globalization and the continuous quality improvement of people’s life in China, imported food has become an important food source for Chinese consumers, and people’s safety requirements for imported food are also increasing. The General Administration of Quality Supervision, Inspection and Quarantine of the People’s Republic of China (AQSIQ) attaches great importance to the imported food safety, and supervises the imported food strictly. On 30 July 2015, AQSIQ published the report of the quality and safety of imported food in China in the first half year of 2015.
1. The trade of imported food in China in the first half year of 2015
1.1 Rapid increase in imports
In the first half year of 2015, there were total 552,000 batches of imported food (20.35 million tons, 22.23 billion dollars) inspected and quarantined by local CIQs. Compared with the same time in 2014, the increase rates for the quantity, weight and sum of money were 11.9%, 21.2% and -10.8%, respectively. From 2005 to 2014, the trade value of imported food has increased by 4.3 times, and the average annual growth rate reached 17.6%, as showed in figure 1.
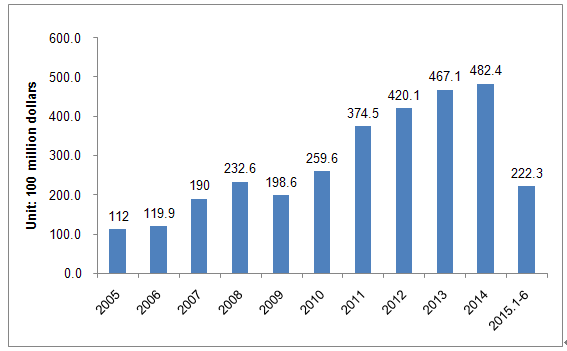
Figure 1. The trade value of imported food in China from 2005 to the first half year of 2015
1.2 Wide range of imported sources
In recent years, the sources of imported food in China have turned more international. In the first half year of 2015, China imported foods from 179 countries or regions. Among them, the top 10 in imported trade value were: the European Union, ASEAN, America, New Zealand, Brazil, Australia, Russia, Canada, Ukraine and South Korea, with a total amount of 17.70 billion dollars, accounting for 79.9% of total trade value (figure 2).
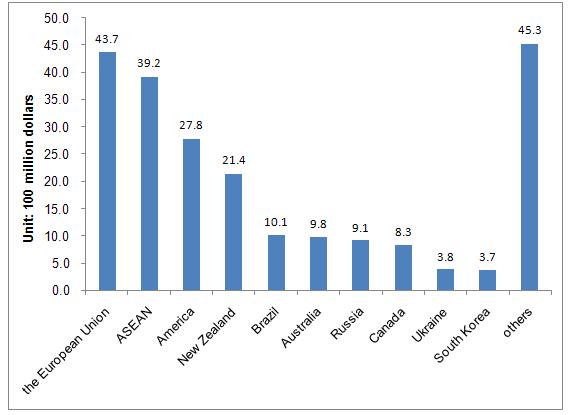
Figure 2. Sources of imported food in China in the first half year of 2015
1.3 Imported food categories were very complete
In recent years, the imported food categories in China have almost covered all kinds of global excellent foods. In the first half year of 2015, the top 10 food categories in imported trade value were: grease and oil, dairy products, aquatic products, meat, cereals and products, wine, sugar, beverage and other processed foods and dried nuts, with a total value of 20.87 billion dollars, accounting for 93.9% of total trade value (figure 3). Among them, the imported volume of vegetable oil, milk powder, meat and aquatic products reached 3.396 million tons, 987 thousand tons, 1.325 million tons and 2.006 million tons, respectively.
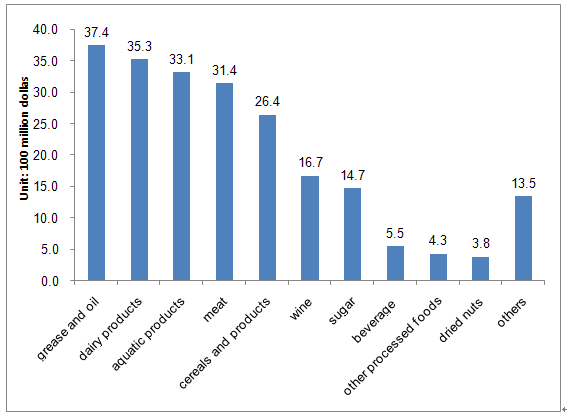
Figure 3. Imported categories in the first half year of 2015
1.4 Import ports were relatively concentrated
The import ports have become more and more in recent years, and mainly in coastal areas. In the first half year of 2015, there were 287 ports used to import food. The top 10 imported ports in imported trade value were: Shanghai, Tianjin, Qingdao, Shenzhen, Dalian, Guangzhou, Xiamen, Yantai, Nantong, and Beijing, with a total value of 16.03 billion dollars, accounting for 72.1% of the total trade value (figure 4)
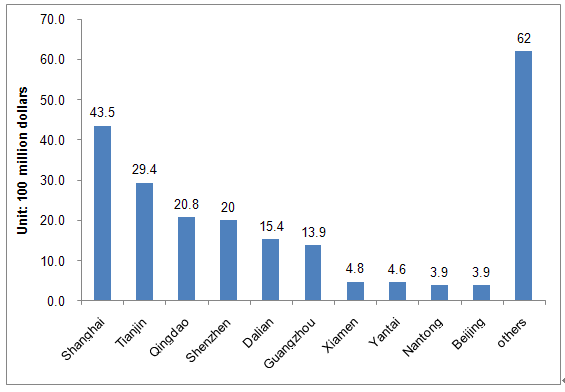
Figure 4. Import ports in the first half year of 2015
2. Quality and safety report of imported food in China in the first half year of 2015
2.1 Imported food safety situation is stable
Over these years, the overall situation of the quality and safety of imported food in China has remained stable, without serious imported food quality and safety problems occurred. In the first half year of 2015, AQSIQ further strengthened the inspection and quarantine of imported food. There were 1255 batches of unqualified imported food from 57 countries and regions inspected by local CIQs, and the total weight of these unqualified foods was 4960 tons, the value was 14.52 million dollars. Compare with the same time in last year, the unqualified batches were decreased by 12.3% (Figure 5), indicating that the quality of imported food raises steadily.
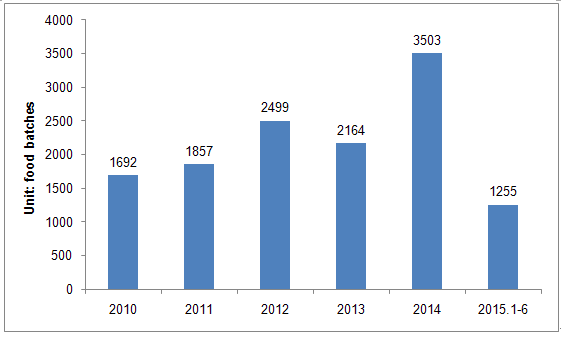
Figure 5. The amount of unqualified imported food from 2010 to the first half year of 2015
2.2 The main categories of unqualified imported food
In the first half year of 2015, almost all types of imported food were detected in non-compliance with national standards of food safety and regulatory requirements in China. And the top 10 food categories in food batches were: drinks, cakes and biscuits, cereal and products, sugar, other processed food, aquatic products, wine, dairy products, condiments, and dried nuts, accounting for 90.1% of the total unqualified imported food batches(Figure 6).
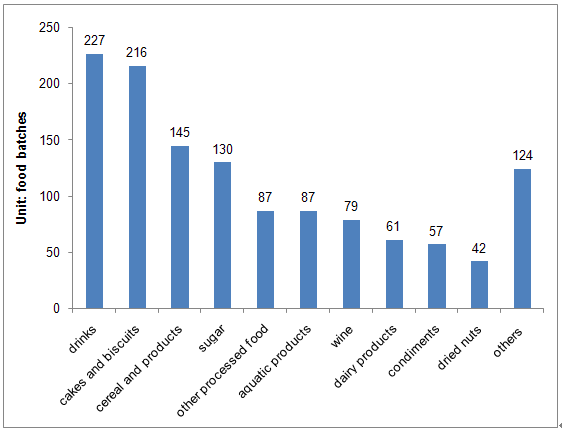
Figure 6. Unqualified categories imported food in China in the first half year of 2015
2.3 The main source of unqualified imported food
In the first half year of 2015, the local CIQ rejected or destroyed the unqualified imported food from 57 countries or regions. The top 10 sources of the non-compliant imported food were: the European Union, Taiwan, ASEAN, America, Japan, South Korea, Canada, Norway, New Zealand and Australia, respectively, which covered 91.5% of the total unqualified imported food batches (Figure 7).
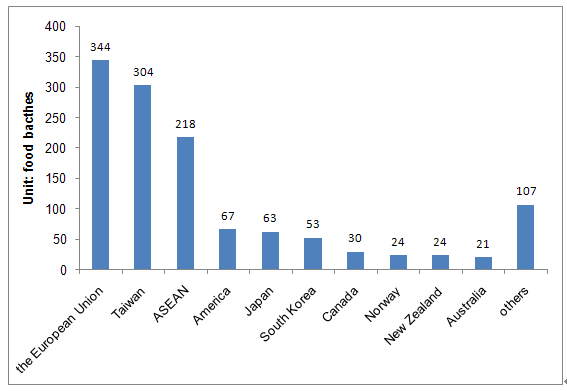
Figure 7. The sources of unqualified imported food in the first half year of 2015
2.4 Main reasons for unqualified imported food.
There were 19 kinds of non-compliant reasons for the unqualified imported food in the first half year of 2015. And the top 10 reasons were: in-compliant food additive, unqualified microorganism, unqualified character, non-compliant label, substandard certificate, exceeded pollutants, certificate does not match the goods, unqualified package, non-edible additives, and genetically modified ingredients, which covered 97.4% of the total unqualified imported food batches (Figure 8). Among the safety and health problems, exceeded food additives, microbial contamination, and exceed pollutants were more outstanding, which accounted for 48.0% of the total unqualified imported food. Among the non safety or health issues, the 3 main problems were: unqualified character, non-compliant label, and substandard certificate, which accounted for 43.6% of the total unqualified imported food.
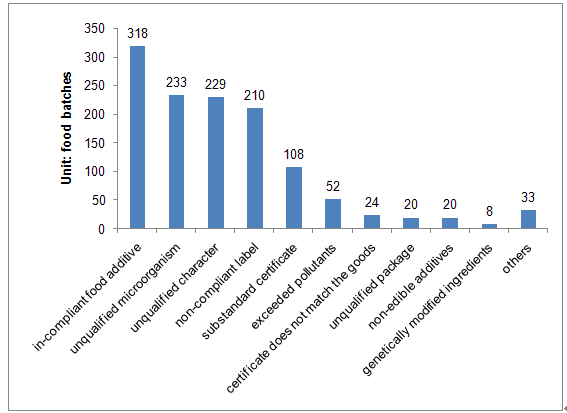
Figure 8. Non-compliant reasons for the unqualified imported food in the first half year of 2015
Different categories of imported food have different non-compliant reasons. The main rejected reasons for beverages, cakes and biscuits and sugar were food additives (like acid red, benzoic acid, sodium aluminosilicate, etc. )exceeded or out of the scope. And for wine and cereal grain products, the main unqualified reason was heavy metals (like Cu, Fe, etc. ) exceed the standard. And for imported aquatic products, food-borne pathogen contamination (like Listeria monocytogenes, Salmonella, and etc.) was the main unqualified reason.
Reference:
http://jckspaqj.aqsiq.gov.cn/xwzx/xw/201507/t20150730_446103.htm
Contact us:
Ms. Cathy Yu Team Leader of Food Safety and Regulatory Affairs Department, CIRS China
11F Dongguan Building, 288 Qiuyi Road, Binjiang District, Hangzhou, China, 310020
Tel : +86 571 8720 6538 | Fax : +86 571 8720 6533
Email:cathy.yu@jianzaoshiwang.cn
1. The trade of imported food in China in the first half year of 2015
1.1 Rapid increase in imports
In the first half year of 2015, there were total 552,000 batches of imported food (20.35 million tons, 22.23 billion dollars) inspected and quarantined by local CIQs. Compared with the same time in 2014, the increase rates for the quantity, weight and sum of money were 11.9%, 21.2% and -10.8%, respectively. From 2005 to 2014, the trade value of imported food has increased by 4.3 times, and the average annual growth rate reached 17.6%, as showed in figure 1.

Figure 1. The trade value of imported food in China from 2005 to the first half year of 2015
1.2 Wide range of imported sources
In recent years, the sources of imported food in China have turned more international. In the first half year of 2015, China imported foods from 179 countries or regions. Among them, the top 10 in imported trade value were: the European Union, ASEAN, America, New Zealand, Brazil, Australia, Russia, Canada, Ukraine and South Korea, with a total amount of 17.70 billion dollars, accounting for 79.9% of total trade value (figure 2).

Figure 2. Sources of imported food in China in the first half year of 2015
1.3 Imported food categories were very complete
In recent years, the imported food categories in China have almost covered all kinds of global excellent foods. In the first half year of 2015, the top 10 food categories in imported trade value were: grease and oil, dairy products, aquatic products, meat, cereals and products, wine, sugar, beverage and other processed foods and dried nuts, with a total value of 20.87 billion dollars, accounting for 93.9% of total trade value (figure 3). Among them, the imported volume of vegetable oil, milk powder, meat and aquatic products reached 3.396 million tons, 987 thousand tons, 1.325 million tons and 2.006 million tons, respectively.

Figure 3. Imported categories in the first half year of 2015
1.4 Import ports were relatively concentrated
The import ports have become more and more in recent years, and mainly in coastal areas. In the first half year of 2015, there were 287 ports used to import food. The top 10 imported ports in imported trade value were: Shanghai, Tianjin, Qingdao, Shenzhen, Dalian, Guangzhou, Xiamen, Yantai, Nantong, and Beijing, with a total value of 16.03 billion dollars, accounting for 72.1% of the total trade value (figure 4)

Figure 4. Import ports in the first half year of 2015
2. Quality and safety report of imported food in China in the first half year of 2015
2.1 Imported food safety situation is stable
Over these years, the overall situation of the quality and safety of imported food in China has remained stable, without serious imported food quality and safety problems occurred. In the first half year of 2015, AQSIQ further strengthened the inspection and quarantine of imported food. There were 1255 batches of unqualified imported food from 57 countries and regions inspected by local CIQs, and the total weight of these unqualified foods was 4960 tons, the value was 14.52 million dollars. Compare with the same time in last year, the unqualified batches were decreased by 12.3% (Figure 5), indicating that the quality of imported food raises steadily.

Figure 5. The amount of unqualified imported food from 2010 to the first half year of 2015
2.2 The main categories of unqualified imported food
In the first half year of 2015, almost all types of imported food were detected in non-compliance with national standards of food safety and regulatory requirements in China. And the top 10 food categories in food batches were: drinks, cakes and biscuits, cereal and products, sugar, other processed food, aquatic products, wine, dairy products, condiments, and dried nuts, accounting for 90.1% of the total unqualified imported food batches(Figure 6).

Figure 6. Unqualified categories imported food in China in the first half year of 2015
2.3 The main source of unqualified imported food
In the first half year of 2015, the local CIQ rejected or destroyed the unqualified imported food from 57 countries or regions. The top 10 sources of the non-compliant imported food were: the European Union, Taiwan, ASEAN, America, Japan, South Korea, Canada, Norway, New Zealand and Australia, respectively, which covered 91.5% of the total unqualified imported food batches (Figure 7).

Figure 7. The sources of unqualified imported food in the first half year of 2015
2.4 Main reasons for unqualified imported food.
There were 19 kinds of non-compliant reasons for the unqualified imported food in the first half year of 2015. And the top 10 reasons were: in-compliant food additive, unqualified microorganism, unqualified character, non-compliant label, substandard certificate, exceeded pollutants, certificate does not match the goods, unqualified package, non-edible additives, and genetically modified ingredients, which covered 97.4% of the total unqualified imported food batches (Figure 8). Among the safety and health problems, exceeded food additives, microbial contamination, and exceed pollutants were more outstanding, which accounted for 48.0% of the total unqualified imported food. Among the non safety or health issues, the 3 main problems were: unqualified character, non-compliant label, and substandard certificate, which accounted for 43.6% of the total unqualified imported food.

Figure 8. Non-compliant reasons for the unqualified imported food in the first half year of 2015
Different categories of imported food have different non-compliant reasons. The main rejected reasons for beverages, cakes and biscuits and sugar were food additives (like acid red, benzoic acid, sodium aluminosilicate, etc. )exceeded or out of the scope. And for wine and cereal grain products, the main unqualified reason was heavy metals (like Cu, Fe, etc. ) exceed the standard. And for imported aquatic products, food-borne pathogen contamination (like Listeria monocytogenes, Salmonella, and etc.) was the main unqualified reason.
Reference:
http://jckspaqj.aqsiq.gov.cn/xwzx/xw/201507/t20150730_446103.htm
Contact us:
Ms. Cathy Yu Team Leader of Food Safety and Regulatory Affairs Department, CIRS China
11F Dongguan Building, 288 Qiuyi Road, Binjiang District, Hangzhou, China, 310020
Tel : +86 571 8720 6538 | Fax : +86 571 8720 6533
Email:cathy.yu@jianzaoshiwang.cn


